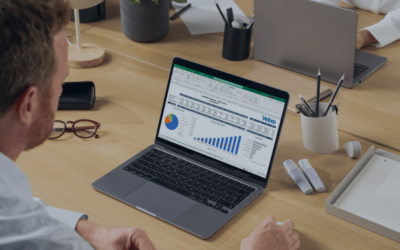
Think of the term dashboard. What image does it conjure up in your head? Most likely, you picture the gauges and dials that sit behind the steering wheel in your car.
Reporting dashboards in Acumatica cloud ERP are not that different from your car dashboard. They should be the first place you look to analyze real time trends and understand how well your business is running. Now, with that in mind, let’s look closer at Acumatica analytics dashboards and how to set them up.
Acumatica analytics dashboards, what can you do with them?
Acumatica dashboards are an easy way to display data that is most essential to your role. They help you keep a close watch on things and make informed decisions.
See them in action in this short video.
Generic Inquiries, the Fuel for Your Acumatica Dashboards
Generic inquiries are customizable queries that retrieve specific data from your Acumatica database. They’re like requests for information tailored to your needs. You can define the criteria, filters, and fields you want to include in these inquiries.
The Relationship between Dashboards and Generic Inquiries:
- Input Source: Generic inquiries serve as the primary source of data for Acumatica dashboards. When you create a dashboard, you typically select one or more generic inquiries to populate it with relevant data.
- Data Visualization: Acumatica uses the data generic inquiries retrieve to populate the charts and graphs on your dashboard. These visualizations help you interpret the data more easily and make informed decisions.
- Real-Time Insights: Generic inquiries can retrieve real-time data from your Acumatica database. So, the information displayed on your dashboards is also up-to-date. You can monitor key metrics and performance indicators in real-time, allowing for timely analysis and action.
What kind of information can I display on my Acumatica ERP dashboard?
Acumatica dashboards allow you to take information from your ERP system and visualize it for in depth data analysis. They offer all the common chart types you would expect to see, including:
- Line chart
- Bar chart
- Stacked bar chart
- Column chart
- Stacked column chart
- Doughnut chart
- Funnel chart
- Tables
- Scorecard/trend card
Plus, a few less common dashboard options—
- Power BI tile —Embed information from your Power BI report directly into Acumatica.
- Embedded page widget—Feed information from an external webpage, like Google Analytics, into your Acumatica dashboard.
- Wiki page widget—Show information from your company wiki on your Acumatica dashboard. This is useful if you want to minimize the time you must spend switching between applications.
To dive deeper into how to use each and what they can do, visit this webpage.
Customization Is Key
The information needed by your executive team is far different from what is needed by your shipping and receiving department, isn’t it? Acumatica reporting tools make this customization easy. Using the drag and drop interface, you can add items to your dashboard, remove them, resize them, reorganize them and more. Better yet, you don’t need any development expertise, or help from IT.
Other dashboard display customization options
- Customize dashboard widget settings—You can customize the settings of each widget. Easily make changes like switching the data source, adjusting the display options, and adding or removing columns.
- Add custom calculations—Display custom calculations on your dashboard. This is helpful for tasks such as calculating year-over-year growth or calculating a specific KPI.
- Apply custom filters—You can create custom filters to display specific data on your dashboard. Use this for things like filtering by date range, customer, or product.
- Select color schemes and layouts—Choose from a variety of color schemes and layouts. Find the ideal combination that makes your dashboard visually appealing and easy to read.
- Share and schedule—Share your dashboard with other users and schedule it to refresh at a specific time, such as daily, weekly, or monthly.
How do I get started setting up my Acumatica analytics dashboard?
- Make sure your Acumatica administrator has given you the right to edit your dashboard
- Decide what type and how many widgets you want to include in your dashboard. It’s a good idea to keep this number to 10 or less. That way, the dashboard does not become overcrowded and difficult to read.
- Open the dashboard you want to work on. Not sure how to do that? Check out this Acumatica help article.
- Click the “Create User Copy” button at the top of the dashboard page to create your own personal copy will work on. Please note—if you do not see this button at the top of the dashboard page, you do not have the access rights to edit your dashboard. You will need to request them from your system administrator before going any further.
- Click the “Design” button at the top of your dashboard page. This switches you into design mode. You can now remove widgets, resize them, move them around and add new ones.
- To remove a widget—Click the trashcan icon on the widget toolbar.
- To resize a widget—Select, a widget. Drag its corners or borders to adjust its size.
- To move a widget—Click on the widget’s title and drag it to the desired location.
- To add a widget—Find a placeholder in the widget area. Click “Add A New Widget.” This will open a new dialog box. From here, you can select the widget you would like to add.
For detailed instructions on populating your new widget with data and configuring it, read this help article.
Wrapping Up
Once you know the basics, building the Acumatica analytics dashboard of your dreams is simple. Should you need more direction, the Acumatica help files are a great place to start. Chances are you’ll find the answer to all your Acumatica questions there. Not just those about the analytics dashboards.
Are you looking for more great Acumatica tips and tricks like this one? Check out our blog archives.


